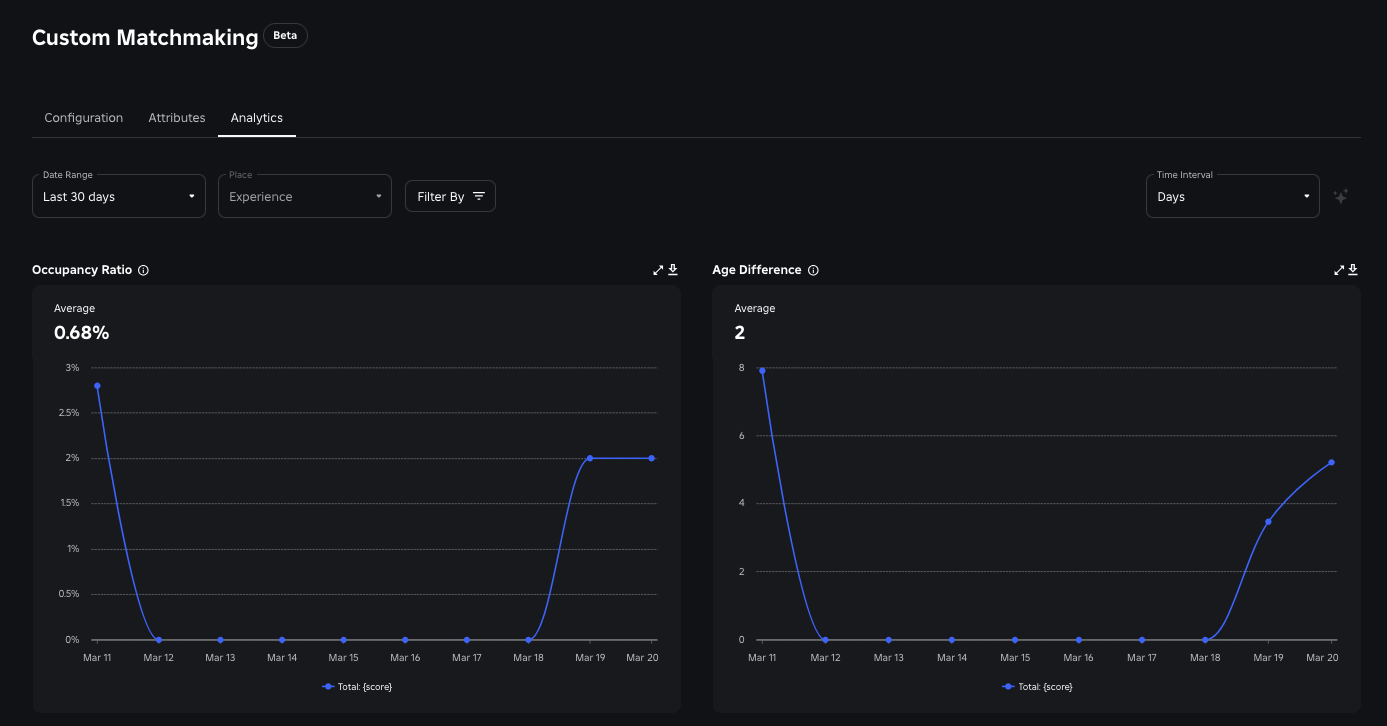
Use the matchmaking analytics dashboard metrics to analyze the impact of individual matchmaking configurations and monitor signal performance over different periods of time.
Access the dashboard
To access the matchmaking analytics dashboard:
- In the Creator Dashboard, navigate to Creations, then select an experience.
- In the lefthand navigation, navigate to the Configure section, then select Custom Matchmaking.
- In the horizontal navigation, select the Analytics tab.
See metrics for a specific place
The analytics dashboard includes charts for Roblox signals and custom signals. If a matchmaking configuration has one numerical custom signal and one categorical custom signal, data is populated in both the numerical and categorical signal charts. If a configuration has two of the same type of custom signal (as in, two numerical or two categorical), only one of the charts is populated with two lines representing data for both. Categorical charts represent a similarity ratio, while numerical charts represent the difference.
To see matchmaking metrics for a specific place in your experience:
- In the Analytics tab, click the Date Range dropdown and select a date range between the previous day and the last 90 days.
- Click the Place dropdown and select the place you want to see metrics for. The Current Configuration updates with the name of the matchmaking configuration applied to the place you selected.

If the selected place doesn't have a custom matchmaking configuration applied to it, the dashboard shows metrics for the default Roblox matchmaking configuration.
Filter by percentile values
In the Analytics tab, select the Filter By menu to swap signal charts between averages and the following percentile values:
- P90 to filter by the number of values that fall within the 90th percentile.
- P10 to filter by the number of values that fall within the 10th percentile.
- P50 to filter by the median, with half of all values falling above it and half below it.
The filter applies to all signal charts.
Signal charts
The Analytics tab includes the following signal charts:
| Chart | Description |
|---|---|
| Occupancy Ratio | The average/P10/P50/P90 occupancy ratio of the chosen server. |
| Average for Preferred Player Match Ratio | The average percentage of matchmaking requests that match the joining player to a server with preferred players. |
| Age Difference | The average/P10/P50/P90 value of the age difference between the joining player and the mean age of all players in the chosen server. |
| Common Language Ratio | The average/P10/P50/P90 common language ratio of the chosen server. The common language is the language shared between existing players in the server and the joining player. |
| Estimate Ping | The average/P10/P50/P90 estimate ping value of the chosen server. |
| Voice Chat Ratio | The average/P10/P50/P90 occupancy ratio of players with voice chat enabled in the chosen server. |
| Common Device Ratio | The average/P10/P50/P90 common device ratio of the chosen server. The common device is the device type shared between existing players in the server and the joining player. |
| Play History Difference | The average/P10/P50/P90 value of the play history difference between the joining player and the mean play history of all players in the chosen server. |
| Numerical Custom Signal Difference | The average/P10/P50/P90 value of the numerical signal difference between the joining player and the server average. |
| Categorical Custom Signal Similarity Ratio | The average/P10/P50/P90 categorical signal similarity ratio between the joining player and the server average. |