Studio offers many debugging tools and workflows commonly found in Integrated Development Environments (IDEs). These help you inspect and resolve errors in scripts as they run.
Breakpoint debugging
Breakpoints are checkpoints that pause or "break" the execution of your scripts at specific lines. You can use the pauses to inspect and debug your game, watch variables, and inspect the call stack. Breakpoints are one of the most effective ways to debug functions, so they're one of the most important debugging tools.
Management
In the Script Editor, you can insert several types of breakpoints and edit the configuration of a breakpoint at any time, including during playtest sessions. If you edit breakpoints during a playtest session, the edits persist even after you finish it. You can also edit a breakpoint that's actively pausing your playtest session, but changes don't apply until the next playtest session.
Insert
Breakpoints take multiple variations and can be inserted at any line of executable code as follows:
To insert a standard breakpoint at a line of code, click in the gutter directly to the right of its line number. Alternatively, right‑click in the gutter and select Insert Breakpoint. The breakpoint icon appears as a red circle.

Disable
To temporarily disable a breakpoint without deleting it, use any of the following workflows:
- Click the breakpoint's icon.
- Right-click the breakpoint's icon and select Disable Breakpoint.
- Edit the breakpoint and toggle its Enabled checkbox.
A disabled breakpoint appears as a hollow version of its enabled icon, for example a hollow circle for a disabled standard breakpoint, or a hollow diamond for a disabled logpoint.


Delete
To delete a breakpoint, middle-click its icon or right‑click its icon and select Delete Breakpoint.
Edit
You can edit the configuration of a breakpoint at any time, including during playtest sessions. If you edit breakpoints during a playtest session, the edits persist even after you finish it. You can also edit a breakpoint that's actively pausing your playtest session, but changes don't apply until the next playtest session.
To edit a breakpoint:
Right-click the breakpoint icon and select Edit Breakpoint.
In the Edit Breakpoint window, configure the breakpoint as desired. You can mix these configurations together to best suit your debugging needs.
Option Description Condition An optional expression that determines whether the breakpoint activates. If the condition is empty, the breakpoint always activates. If the condition exists, the breakpoint becomes a conditional breakpoint and activates only if the condition is true. For example, if you want the breakpoint to activate only if the variable var equals 10, set the condition to var == 10. Log Message An expression that prints to the Output window when the breakpoint is hit. The format of the log message is the same as that of a print() statement. For example, set the log message as "The value of var:", var to output the same message as print("The value of var:", var). Continue Execution Determines whether the breakpoint pauses the script if it activates. This option is disabled by default unless the inserted breakpoint is a logpoint. Remove Breakpoint on Hit If checked, the breakpoint automatically removes itself after the first playtest session, effectively making it a temporary breakpoint. Trigger At The context of a breakpoint determines whether it should activate on the Client (client‑side scripts), Server (server‑side scripts), or Edit (debugging plugin scripts). If you choose Custom Context, the window indicates the current trigger contexts.
Workflow
The typical workflow for breakpoint debugging is as follows:
Open the script you'd like to debug and insert breakpoints on the lines of codes that you want to examine.
From Studio's mezzanine, initiate a playtest to begin debugging.

When the script hits a breakpoint, the playtest session pauses unless that breakpoint is configured to continue execution. A yellow arrow over the breakpoint indicates which line of code executes next.
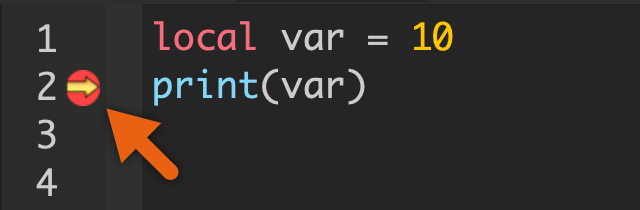
As the script pauses, inspect the Breakpoints window, Watch window, Call Stack window, Output window, and Script Editor to find information about variable values and function executions.
To continue executing code after hitting a breakpoint, click Resume Scripts in the mezzanine.

You can also execute code one line at a time with the stepping buttons in the mezzanine:

Action Shortcut Description Step Into F11 The Step Into button moves the debugger into the code of the function on the current line. If there is no function on the current line, the debugger moves to the next line. Step Over F10 The Step Over button moves the debugger to the next line of code, not moving into functions. Step Out ShiftF11 The Step Out button moves the debugger out of the current function and to the next line of code after the function call. If the current line isn't inside a function, the debugger moves to the next line. When you're finished debugging the current session, click the Stop button.



Monitoring
Studio includes multiple windows and tools to monitor variable values and function executions while debugging. With this information, you can find the root cause of most problems in your scripts.

Breakpoints
The Breakpoints window is a unified view that shows all breakpoints within all scripts. To open it, click Breakpoints from Studio's Script tab toolbar, or navigate to the Window ⟩ Debug menu and toggle on Breakpoints.
In the window, the Script and Line columns always display, and you can toggle on/off other configuration columns through the ⋮ menu in the upper‑right corner. Within the Script column, right‑click any breakpoint to reveal an options menu to edit, disable/enable, delete, or jump to the breakpoint's line within the script.

While in a debugging session, the furthest left column shows (x3) which indicates the multiple contexts (Client, Server, Edit) for the breakpoint. By expanding any breakpoint's branch, you can then click the icon next to a specific context to disable/enable it for that context, such as disabling a breakpoint only in the Client context while keeping it enabled in the Server context.

Call Stack
The Call Stack window, accessible from Studio's Script tab toolbar or the Window ⟩ Debug menu, shows which line of code is going to execute next when the debugger reaches a breakpoint. If you call functions from inside other functions, it indicates which lines those functions were called from, letting you confirm whether the actual call flow matches the expected flow.


As the script pauses at breakpoints, use the stepping buttons in the mezzanine to step into, over, or out of a function/line as outlined in workflow.

Watch
The Watch window, accessible from Studio's Script tab toolbar or the Window ⟩ Debug menu, lets you actively watch variable and expression values as you step through breakpoints.
The Variables tab shows information about the current variables in scope, filterable by clicking the All Scopes button in the window's upper bar. Expanding a branch shows the members of that variable or instance and their values. You can also watch any variable by double‑click highlighting it in the Script Editor, right‑clicking, and selecting Add Watch from the popup menu.


Script Editor
The debugger is integrated with the Script Editor. When your game pauses at a breakpoint in a script, you can hover your mouse over the name of a variable to see its value. For example, you can see the composition of a table and its contained keys/values.

Additional debugging tools
In addition to the debugger, Studio offers additional debugging tools for you to fix problems and bugs in your game.
Command Bar
The Command Bar allows you to run Luau commands while the game is running. It is available in Studio from the Window ⟩ Script menu and in the Developer Console.
Developer Console
The Developer Console provides a wide array of details including client and server output, memory usage, network performance, and more. To open console while testing or playing a game, type /console into the chat or press F9.
Log files
When a script prints or errors in Studio or the player app, the app records the message in a log file in the local file system. These files are located in different places depending on the operating system.
Windows
To access log files on Windows:
- Open File Explorer.
- Navigate to the %LOCALAPPDATA%\Roblox\logs directory.
- Double-click a log to open it. Logs with the same XXXXX value are from the same Studio session.
Mac
To access log files on Mac:
- Open Finder.
- In the menu bar, select Go ⟩ Go to Folder....
- In the dialog, enter ~/Library/Logs/Roblox.
- Double-click the result to navigate to the Roblox logs directory.
- Inside the directory, double-click a log to open it.
iOS
You can collect iOS logs using a Mac or using an iOS device.
To access iOS log files on a Mac:
- Connect the iOS device to a Mac.
- Open Finder.
- Navigate to Utilities and open the Console application.
- To populate real-time logs in the Console application, select the iOS device from the sidebar, click the Start button, and reproduce the issue on the iOS device.
- To populate archived logs in the Console application, run sudo log collect --device-name "[iOS Device Name]" in the Terminal. Make sure there are no apostrophes in the device's name or you might get an error when running the command.
Android
To access log files on Android:
- Navigate to Settings ⟩ System ⟩ Developer options.
- Toggle Developer options on.
- On a computer, download and install Android Studio.
- In Android Studio, click Logcat.
- Connect the Android device to the computer to automatically populate Logcat with logs.